
Dashboard
The Dashboard reads the published form and the items on your board, so a change made on the board shows here too. Choose the period at the top: the last 7, 14, 30, 60 or 90 days, or all time.
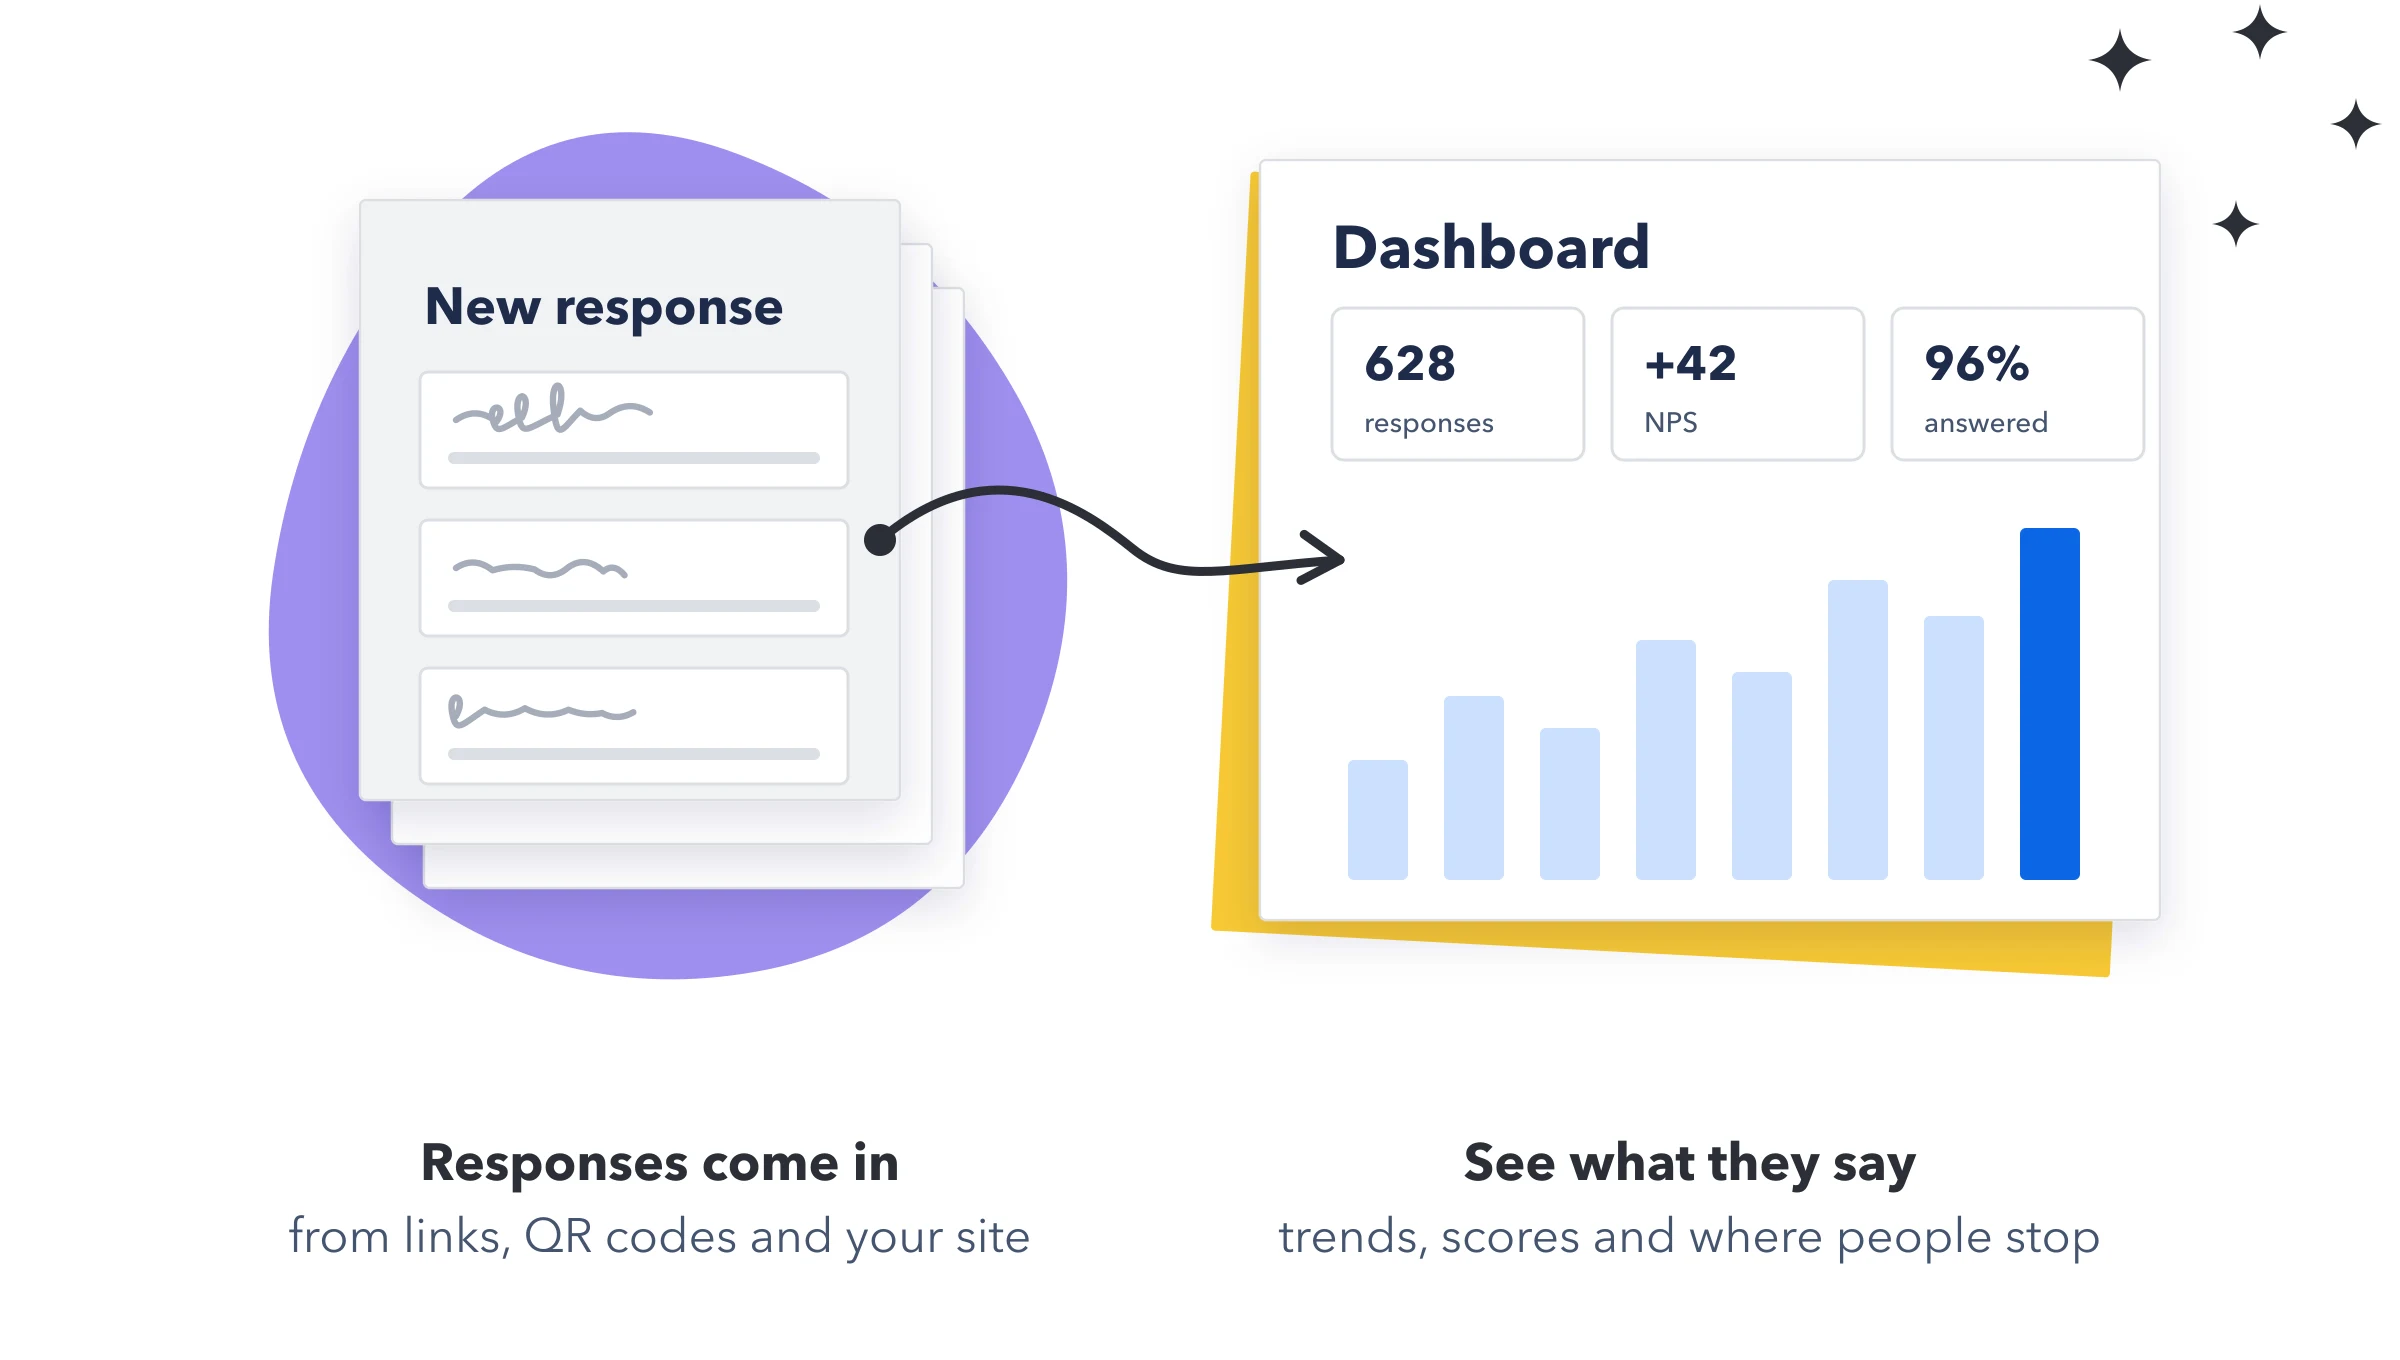
At the top
- Compare with the period before: on by default. It adds the period before to the chart as a dashed line, and a change tag to the headline figures, like ↗ 2.6×. All time has nothing to compare with.
- The status line: whether the form is accepting responses, whether editing is on, how much of the maximum is used and when the form is likely to fill up, and when the last response came in. Settings opens Form settings.
- The summary: one sentence with the number of responses, how it compares with the period before, and the most common answer when one clearly leads, like "Acme Logistics is the most common Customer (44%)".
- Highlights, under the summary, appear only when the numbers clearly back them: an answer whose share rose or fell by 10 points or more, the question most people stop at, and the busiest two hours of the week. Click a highlight about an answer to see only those responses.
| Headline figure | What it shows |
|---|---|
| Responses | Responses in the period, the total so far, and a small trend line. |
| Visitors who send it | The share of visits to the form that ended in a response. Until visits are counted, Edited after sending instead. |
| Net Promoter Score | With a 0 to 10 scale question: the score, the average, and how many are promoters, passives and detractors. With a star rating instead: the average stars. With neither: Questions answered, the share of questions answered on average. |
| Time to fill in | The typical time from the first answer to sending, and what most people take. Until times are recorded, Last response instead. |
Click a headline figure to open its chart full screen (all but Last response). See Open a chart full screen.
Under them, Responses per week (per day over 7 or 14 days) is a line with a round marker for each week, and the period before as a dashed line; point at a marker to see both counts. Weeks are counted back from today, so a short first week counts in the totals but isn't drawn, and a note under the chart says so. The donut beside it shows how many responses were Sent once and how many were Edited later.
Next to it, Latest responses lists the five newest with two of their answers, each linked to its item, and View all opens Responses.
Answers
A card for each question with answers to count. The first six show; Show all shows the rest.
- Choice questions (Status, Dropdown, Checkbox, People, Connect boards, Dependency and options from another board): a donut, with a legend of the five most common answers, how many gave each and their share. The rest are grouped as Other answers.
- Ratings and scales: the average and a bar for each score. A 0 to 10 scale also gets a Net Promoter Score gauge, with promoters, passives and detractors in green, yellow and red.
- Number questions: the total, average, lowest and highest.
Net Promoter Score is the share of people who gave 9 or 10, minus the share who gave 0 to 6. It runs from -100 to +100.
Show only some responses
Click an answer in a card's legend to see only the responses that gave it. The whole page follows: the summary, the headline figures, the chart, the other cards, the latest responses, Ask AI and Export CSV. The question you clicked keeps all its answers, with yours highlighted, so another answer is one click away. Click it again, or Show all in the blue banner, to see everything again.
- Show only… at the top lists the same answers, and the link tags (see When and where), with how many responses each has.
- Visits are counted for the whole form, never per answer. So while a filter is on, Visitors who send it is left out and the visitor steps show everyone.
Compare two questions
Press Compare two questions above the cards and choose two choice questions, like Request type by Priority. Each cell counts the responses that gave both answers, and darker cells have more. The 8 most common answers of each question are shown.
Visitors
From opening the form to sending it shows how many opened the form, started answering, reached each later page and sent it, with the share lost at each step. Where people stop lists the last question touched by people who left without sending, and questions often left empty (answered by fewer than 9 in 10).
Note: Visits count the public form only, not previews, edit links or item links. Only counts are kept, never answers.
When and where
When responses arrive shows every hour of the week, darker where more responses came in, in your time zone, and names the busiest two hours. Where they come from counts responses by the tag on the link people opened; click a tag to see only those responses.
Add &ref= and a name to a form link to tell it apart, such as &ref=partner for a partner's newsletter or &ref=qr-reception for a poster. Links with utm tags (utm_source, utm_medium and utm_campaign) are counted too. A response with a ref is listed by its ref, otherwise by its utm tags, and the rest as "No ref or utm tag".
Note: Link tags and times are recorded as responses arrive, so responses sent before these were added count as "No ref or utm tag" and aren't in Time to fill in. Only the tags and the time are kept, never answers.
Ask about these responses
Press Ask about these responses under the summary and ask in your own words, like "Which site has the most urgent requests?", "What is the average rating?" or "What do people mention most?". Counts and averages are worked out exactly; AI reads written answers only when you ask about themes, and shows quotes with a link to each item.
- AI never sees emails, phone numbers, links, files or signatures.
- Your account can ask 100 questions a day.
- Export CSV at the top downloads the responses in the chosen period as a spreadsheet.
Open a chart full screen
Click a chart card or a headline figure, or the expand icon that shows when you point at a card, to open it full screen. ← Dashboard, the × or Esc goes back. The period, Compare with the period before and Colours are there too, and a filter you chose stays on.
| Full screen | What it shows |
|---|---|
| Responses over time | Responses, Edits and Completion tabs. Line, Area or Bars, Daily or Weekly, with a zoom slider under daily charts longer than a month. The total, the average per day or week, the busiest day or week, the sent once or edited later donut, and a table of every day or week. |
| A question | A large donut, the answers over time (stacked area, bars or lines, by day or week), and a table of every answer with its share, the period before, the change in points and Show only these. |
| A rating or scale | The Net Promoter Score gauge or the average, how many gave each score, the score or average over time, and for a 0 to 10 scale, promoters, passives and detractors over time. |
| Visitors | The steps from opening the form to sending it, as a chart and a table, the last question touched before leaving, and how often each question is answered. |
| When responses arrive | A larger grid of every hour of the week, and responses by day of the week and by hour of the day. |
| Where responses come from | Each link over time, and a table of every link with Show only these. |
| Time to fill in | The typical time, what most people take, how many were timed, how the times spread, and the typical time over time. |
Edited after sending and Questions answered, when they stand in as headline figures, open Responses over time on the Edits and Completion tabs.
Chart colours
Press Colours, in the toolbar or in any full-screen view, and choose Default, Vivid, Cool or Soft (pastel). The set colours every chart on the Dashboard, and this browser remembers it. Other answers and No ref or utm tag stay grey, and the Net Promoter Score keeps its green, yellow and red.
Responses
Every response in one list, newest first, 25 to a page. Search by item name, show only Edited responses, and click an item to open it in monday.
Export CSV downloads every response with the time it was sent, when it was last edited, how many edits, one column per question and the item ID. It opens correctly in Excel, accents and all.